Market Outlook
April 20, 2017
Market Cues
Domestic Indices
Chg (%)
(Pts)
(Close)
Indian markets are likely to open positive tracking the global cues.
BSE Sensex
0.1
17
29,337
The US markets closed in red yesterday succumbing to a negative earnings reaction
Nifty
(0.0)
(2)
9,104
for Dow stock IBM. Steep declines from oil major Chevron further put pressure on
Mid Cap
0.7
94
14,390
the Dow Jones index which closed 119 points down to 20,404. Meanwhile Nasdaq
Small Cap
0.8
113
14,957
advanced 14 points to 5,863.
Bankex
(0.5)
(130)
24,575
The UK markets on Wednesday finished with losses as investors digested a
parliamentary vote that confirmed Britain will hold an early general election in June.
The FTSE shed 0.5% to end at 7,114. The fall on Wednesday means the benchmark
Global Indices
Chg (%)
(Pts)
(Close)
lost its year-to-date gain, and it’s now down 0.4% for 2017.
Dow Jones
(0.6)
(119)
20,404
A normal monsoon forecast by IMD kept the hope factor alive for stocks yesterday
Nasdaq
0.2
14
5,863
as the Sensex closed marginally higher after four days of losses in the face of muted
FTSE
(0.5)
(33)
7,114
corporate results. The Nifty, however, ended in the red amid a recovery in Europe.
Nikkei
0.1
14
18,432
BSE Sensex closed higher by 17 points, or 0.06%, to 29,337, while the Nifty 50 fell
Hang Seng
(0.4)
(99)
23,826
2 points, or 0.02%, to 9,103.
Shanghai Com
(0.8)
(26)
3,171
News Analysis
Yes Bank - Result analysis
Advances / Declines
BSE
NSE
Detailed analysis on Pg2
Advances
1,571
941
Declines
1,288
730
Investor’s Ready Reckoner
Unchanged
166
84
Key Domestic & Global Indicators
Stock Watch: Latest investment recommendations on 150+ stocks
Volumes (` Cr)
Refer Pg6 onwards
BSE
3,364
Top Picks
NSE
24,069
CMP
Target
Upside
Company
Sector
Rating
(`)
(`)
(%)
Blue Star
Capital Goods
Accumulate
683
760
11.3
#Net Inflows (` Cr)
Net
Mtd
Ytd
Dewan Housing Fin. Financials
Accumulate
401
460
14.6
FII
(812)
(1,684)
42,537
Mahindra Lifespace
Real Estate
Buy
409
522
27.7
MFs
(37)
4,055
13,493
Navkar Corporation Others
Buy
207
265
27.9
KEI Industries
Capital Goods
Buy
207
239
15.3
More Top Picks on Pg4
Top Gainers
Price (`)
Chg (%)
Hathway
45
19.9
Key Upcoming Events
Indiacem
175
8.6
Previous
Consensus
Date
Region
Event Description
Reading
Expectations
Jisljaleqs
108
8.4
Apr 20, 2017 US
Initial Jobless claims
234.00
240.00
Hcc
44
7.2
Apr 20, 2017 Germany PMI Services
55.60
55.50
Geship
453
6.8
Apr 21, 2017 Euro Zone Euro-Zone Consumer Confidence
-5.00
-4.80
Apr 21, 2017 Germany PMI Manufacturing
58.30
58.00
Apr 21, 2017 US
New home sales
592.00
587.50
Top Losers
Price (`)
Chg (%)
Apr 25, 2017 US
Existing home sales
5.48
5.60
Nationalum
68
(7.8)
More Events on Pg5
Jindalstel
113
(5.1)
Auropharma
640
(3.5)
Religare
198
(3.4)
Tv18Brdcst
42
(3.2)
#As on April 19, 2017
Market Outlook
April 20, 2017
News Analysis
Yes Bank - Result analysis
Though the business growth of Yes Bank for 4QFY17 has been strong like other
quarters, the sharp rise in NPAs (QoQ) is an area of concern. In absolute terms,
GNPAs have doubled to `2019 cr from `1006 cr and GNPAs % has gone up to
1.52% vs 0.85% QoQ. According to the management, one large account worth
`911.5cr, has been accounted as an NPA during the quarter. While the
management expects to recover this account in the near term, this, we believe, is a
visible sign of stress in the balance sheet which could weigh on the stock in the
near term. We believe that the recent capital raised by the bank, would be enough
to meet its current growth rate. While sustainable growth is one point to look for,
given the current development, asset quality holds the key to future growth
prospects of the bank.
Other key developments during the quarter are strong growth in loan and deposits
which grew by 34.7% and 27.9% respectively. On CASA front, the bank has shown
yet another quarter of strong performance with 300bps net accretion; as a result
CASA ratio now stands at 36.3%. NIM also continued to see positive direction with
10 bps improvement.
Yes Bank had always attracted premium valuations backed by its strong growth
and robust asset quality. However, with increasing sign of stress on book, further
re-rating in the near term is unlikely for the stock and in the near term the stock is
likely to remain under pressure. We maintain NEUTRAL rating on the stock.
Economic and Political News
FDI framework likely to be relaxed substantially
Future Lok Sabha polls to see paper audit of vote at cost of `3,200 cr
IMF warns of worsening India Inc financials if protectionism rises in world
New RBI rules on provisioning, bad loans seen taking a toll on banks
Corporate News
Cement firm drills `350-cr hole in IndusInd, YES Bank profits
Glenmark plans new launches in US, receives FDA nod for anticoagulant drug
ITC aims to capture 18-20% of India’s juice market through B Natural
Dewan Housing Finance may sell majority stake in Aadhar Housing Finance
Tata, Godrej, Adani show interest in 30 Sahara properties worth `7,400 cr
Market Outlook
April 20, 2017
Quarterly Bloomberg Brokers Consensus Estimate
Hindustan Zinc Ltd - Apr 20, 2017
Particulars ( ` cr)
4QFY17E
4QFY16
y-o-y (%)
3QFY17
q-o-q (%)
Net sales
6,106
3,070
98.9
4,944
23.5
EBITDA
3,522
1,308
169.3
2,783
26.5
EBITDA margin (%)
57.7
42.6
56.3
Net profit
2,903
2,149
35.1
2,320
25.1
HDFC Bank Ltd - Apr 21, 2017
Particulars ( ` cr)
4QFY17E
4QFY16
y-o-y (%)
3QFY17
q-o-q (%)
Net profit
3,921
3,374
16.2
3,865
1.4
ACC Ltd - Apr 21, 2017
Particulars ( ` cr)
1QCY17E
1QCY16
y-o-y (%)
4QCY16
q-o-q (%)
Net sales
3,015
2,927
3.0
2,669
13.0
EBITDA
340
433
(21.4)
254
33.9
EBITDA margin (%)
11.3
14.8
9.5
Net profit
177
232
(23.9)
48
265.8
Ultratech Cement Ltd - Apr 24, 2017
Particulars ( ` cr)
4QFY17E
4QFY16
y-o-y (%)
3QFY17
q-o-q (%)
Net sales
6,493
6,436
0.9
5,540
17.2
EBITDA
1,249
1,353
(7.7)
1,113
12.2
EBITDA margin (%)
19.2
21.0
20.1
Net profit
673
681
(1.2)
563
19.5
Market Outlook
April 20, 2017
Top Picks ★★★★★
Market Cap
CMP
Target
Upside
Company
Rationale
(` Cr)
(`)
(`)
(%)
Strong growth in domestic business due to its leadership in
Alkem Laboratories
24,818
2,076
2,257
8.7
acute therapeutic segment. Alkem expects to launch more
products in USA, which bodes for its international business.
We expect the company would report strong profitability
Asian Granito
1,125
374
405
8.3
owing to better product mix, higher B2C sales and
amalgamation synergy..
Among the top 4 players in the consumer durables segment.
Bajaj Electricals
3,569
352
395
12.1
Improved profitability backed by turn around in E&P segment.
Strong order book lends earnings visibility.
Favourable outlook for the AC industry to augur well for
Cooling products business which is out pacing the market
Blue Star
6,527
683
760
11.3
growth. EMPPAC division's profitability to improve once
operating environment turns around..
With a focus on the low and medium income (LMI) consumer
Dewan Housing Finance
12,567
401
460
14.6
segment, the company has increased its presence in tier-II &
III cities where the growth opportunity is immense.
Strong loan growth backed by diversified loan portfolio and
Equitas Holdings
5,576
165
235
42.4
adequate CAR. ROE & ROA likely to remain decent as risk of
dilution remains low. Attractive valuations considering growth.
Economic recovery to have favourable impact on advertising
& circulation revenue growth. Further, the acquisition of a
Jagran Prakashan
6,455
197
225
13.9
radio business (Radio City) would also boost the company's
revenue growth.
High order book execution in EPC segment, rising B2C sales
KEI Industries
1,610
207
239
15.3
and higher exports to boost the revenues and profitability
Speedier execution and speedier sales, strong revenue visibilty
Mahindra Lifespace
1,678
409
522
27.7
in short-to-long run, attractive valuations
Higher growth in domestic branded sales and healthy export
Mirza International
1,067
89
107
20.6
to boost the profitability.
Massive capacity expansion along with rail advantage at ICD
Navkar Corporation
2,956
207
265
27.9
as well CFS augurs well for the company
Strong brands and distribution network would boost growth
Siyaram Silk Mills
1,606
1,714
1,872
9.2
going ahead. Stock currently trades at an inexpensive
valuation.
Market leadership in Hindi news genre and no. 2 viewership
ranking in English news genre, exit from the radio business,
TV Today Network
1,624
272
344
26.3
and anticipated growth in ad spends by corporates to benefit
the stock.
Source: Company, Angel Research
Market Outlook
April 20, 2017
Key Upcoming Events
Result Calendar
Date
Company
Apr 20, 2017
Mindtree, Infotech Enterprises, Hind. Zinc
Apr 21, 2017
FAG Bearings, ACC
Apr 24, 2017
Rallis, UltraTech Cement, Hexaware
Apr 25, 2017
Wipro, Persistent
Apr 26, 2017
KPIT Cummins
Source: Bloomberg, Angel Research
Global economic events release calendar
Date
Time
Country
Event Description
Unit
Period
Bloomberg Data
Last Reported Estimated
Apr 20, 2017
6:00PM
US
Initial Jobless claims
Thousands
Apr 15
234.00
240.00
1:00PM
Germany
PMI Services
Value
Apr P
55.60
55.50
Apr 21, 2017
7:30PM
Euro Zone
Euro-Zone Consumer Confidence
Value
Apr A
(5.00)
(4.80)
1:00PM
Germany
PMI Manufacturing
Value
Apr P
58.30
58.00
7:30PM
US
New home sales
Thousands
Mar
592.00
587.50
Apr 25, 2017
7:30PM
US
Existing home sales
Million
Mar
5.48
5.60
7:30PM
US
Consumer Confidence
S.A./ 1985=100
Apr
125.60
124.00
Apr 27, 2017
5:15PM
Euro Zone
ECB announces interest rates
%
Apr 27
--
--
Apr 28, 2017
6:00PM
US
GDP Qoq (Annualised)
% Change
1Q A
2.10
1.30
2:00PM
UK
GDP (YoY)
% Change
1Q A
1.90
--
Apr 30, 2017
6:30AM
China
PMI Manufacturing
Value
Apr
51.80
--
May 2,, 2017 2:00PM
UK
PMI Manufacturing
Value
Apr
54.20
--
1:25PM
Germany
Unemployment change (000's)
Thousands
Apr
(30.00)
--
May 3,, 2017 11:30PM
US
FOMC rate decision
%
May 3
1.00
1.00
2:30PM
Euro Zone
Euro-Zone GDP s.a. (QoQ)
% Change
1Q A
0.50
--
May 5,, 2017 6:00PM
US
Change in Nonfarm payrolls
Thousands
Apr
98.00
--
China
Exports YoY%
% Change
Apr
16.40
--
May 8,, 2017 6:00PM
US
Unnemployment rate
%
Apr
4.50
--
May 10, 2017 7:00AM
China
Consumer Price Index (YoY)
% Change
Apr
0.90
--
India
Imports YoY%
% Change
Apr
45.30
--
India
Exports YoY%
% Change
Apr
27.60
--
May 11, 2017
US
Producer Price Index (mom)
% Change
Apr
(0.20)
--
2:00PM
UK
Industrial Production (YoY)
% Change
Mar
2.80
--
4:30PM
UK
BOE Announces rates
% Ratio
May 11
0.25
--
May 12, 2017 5:30PM
India
Industrial Production YoY
% Change
Mar
(1.20)
--
6:00PM
US
Consumer price index (mom)
% Change
Apr
(0.30)
--
12:00PM
India
Monthly Wholesale Prices YoY%
% Change
Apr
5.70
--
Source: Bloomberg, Angel Research
Market Outlook
April 20, 2017
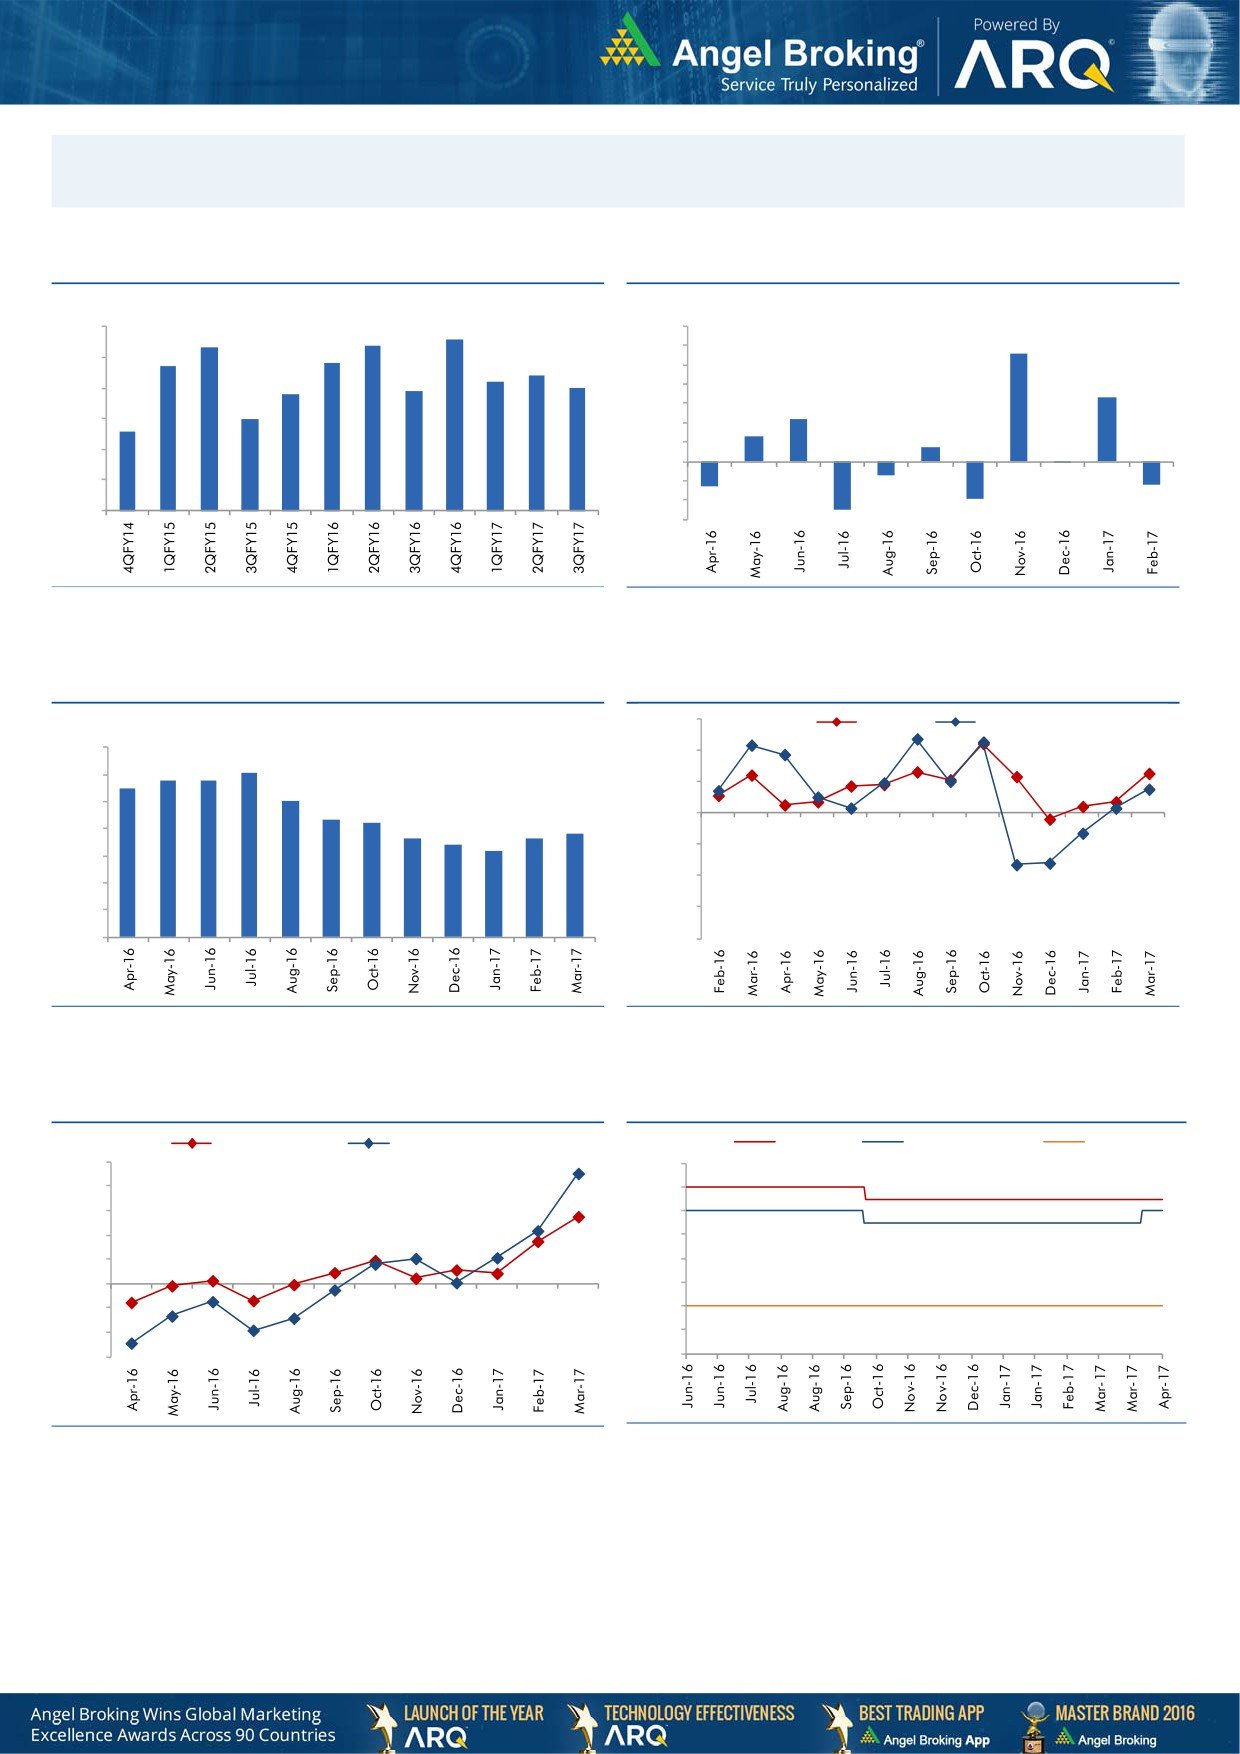
Macro watch
Exhibit 1: Quarterly GDP trends
Exhibit 2: IIP trends
(%)
(%)
8.6
9.0
8.3
8.4
7.0
5.6
7.7
7.8
6.0
8.0
7.4
7.2
5.0
6.9
7.0
6.8
4.0
3.3
7.0
6.0
3.0
2.2
6.0
5.6
1.3
2.0
0.7
1.0
5.0
-
4.0
(1.0)
(0.1)
(0.7)
(2.0)
(1.3)
(1.2)
3.0
(3.0)
(1.9)
(2.5)
Source: CSO, Angel Research
Source: MOSPI, Angel Research
Exhibit 3: Monthly CPI inflation trends
Exhibit 4: Manufacturing and services PMI
56.0
Mfg. PMI
Services PMI
(%)
7.0
54.0
6.1
5.8
5.8
6.0
5.5
5.1
52.0
5.0
4.3
4.2
3.8
50.0
3.6
3.7
4.0
3.4
3.2
48.0
3.0
46.0
2.0
1.0
44.0
-
42.0
Source: MOSPI, Angel Research
Source: Market, Angel Research; Note: Level above 50 indicates expansion
Exhibit 5: Exports and imports growth trends
Exhibit 6: Key policy rates
(%)
Exports yoy growth
Imports yoy growth
(%)
Repo rate
Reverse Repo rate
CRR
50.0
7.00
40.0
6.50
30.0
6.00
20.0
5.50
10.0
5.00
0.0
4.50
(10.0)
4.00
(20.0)
3.50
(30.0)
3.00
Source: Bloomberg, Angel Research
Source: RBI, Angel Research
Market Outlook
April 20, 2017
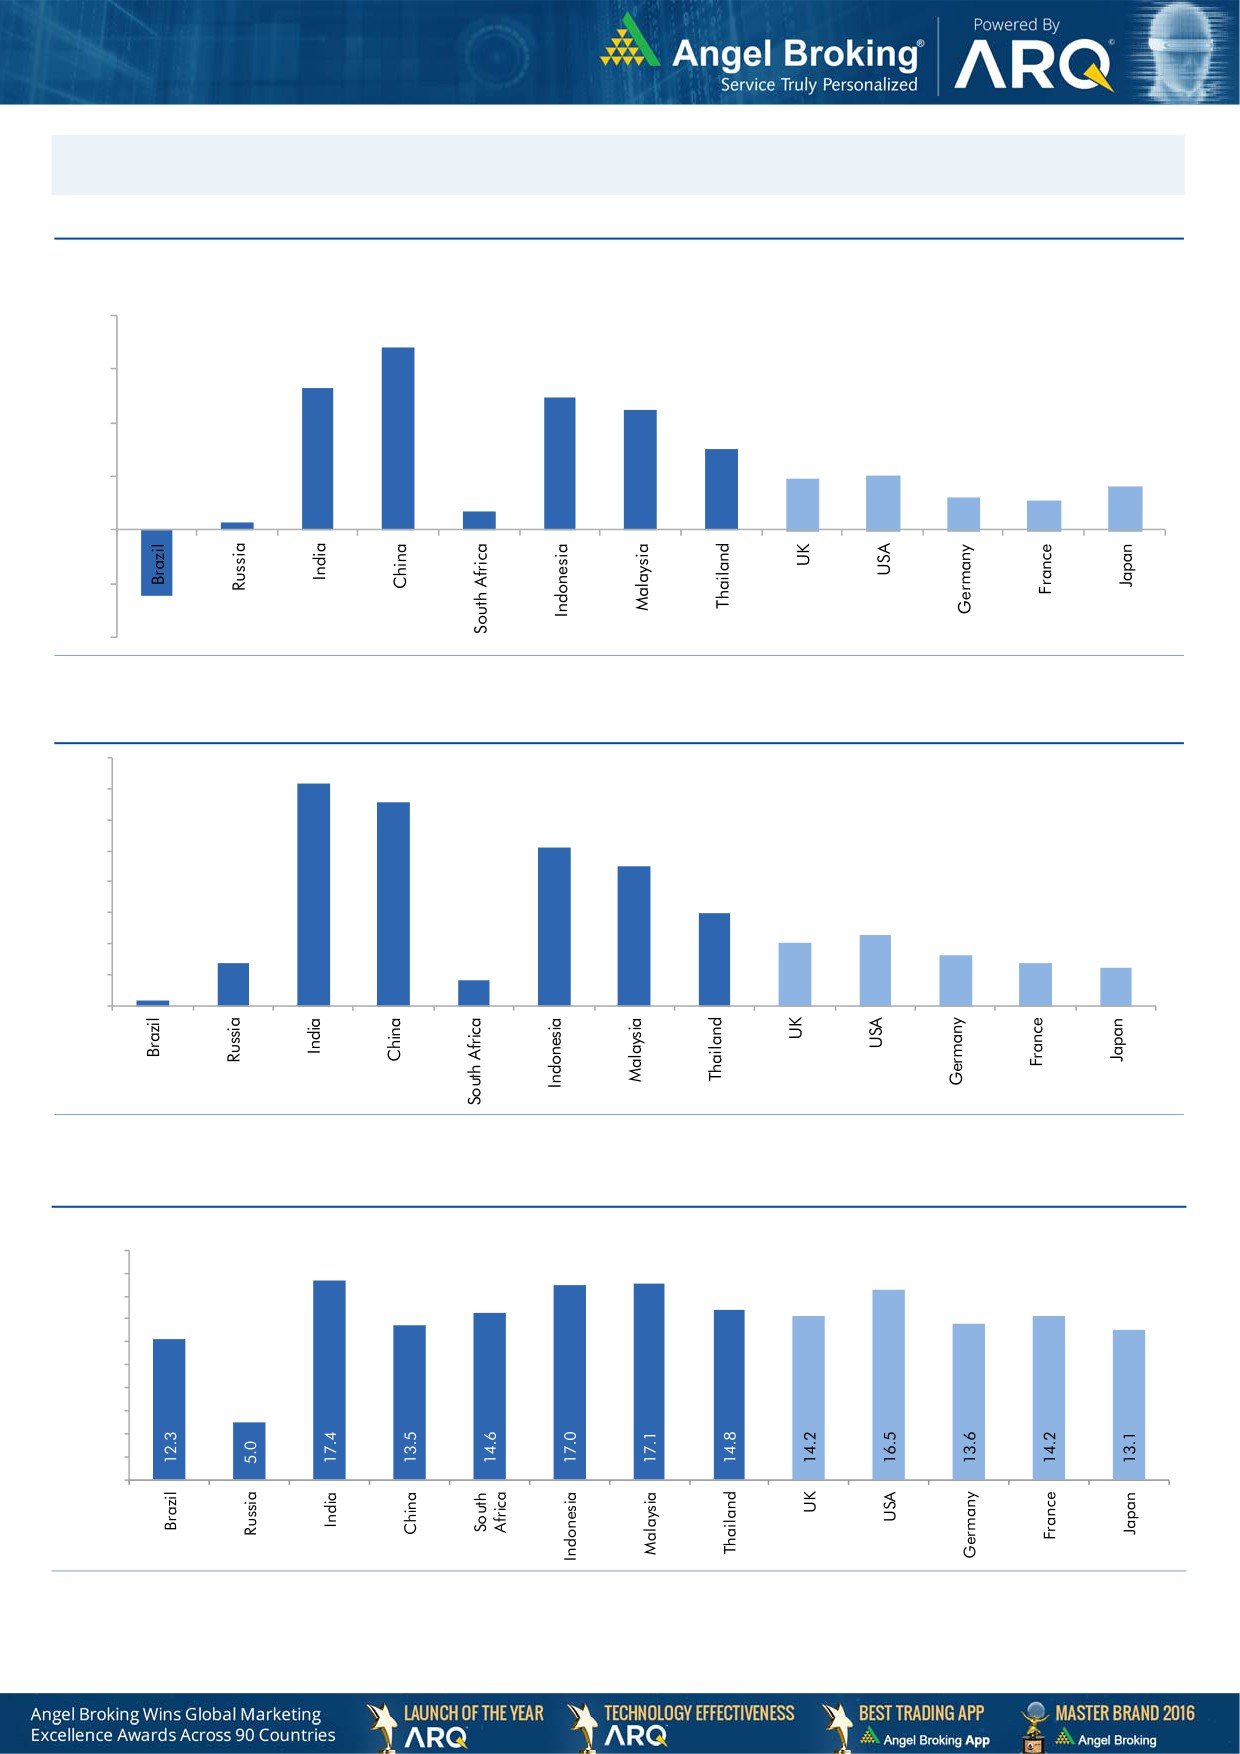
Global watch
Exhibit 1: Latest quarterly GDP Growth (%, yoy) across select developing and developed countries
,
(%)
8.0
6.8
6.0
5.3
4.9
0.7
4.5
4.0
3.0
1.9
2.0
2.0
0.3
1.6
1.2
1.1
-
(2.0)
(2.5)
(4.0)
Source: Bloomberg, Angel Research
Exhibit 2: 2016 GDP Growth projection by IMF (%, yoy) across select developing and developed countries
(%)
7.2
6.6
7.0
6.0
5.1
5.0
4.5
4.0
3.0
3.0
2.3
2.0
1.4
1.6
2.0
1.4
1.2
0.2
0.8
1.0
-
Source: IMF, Angel Research
Exhibit 3: One year forward P-E ratio across select developing and developed countries
(x)
20.0
18.0
16.0
14.0
12.0
10.0
8.0
6.0
4.0
2.0
-
Source: IMF, Angel Research, As of April, 19, 2017
Market Outlook
April 20, 2017
Exhibit 4: Relative performance of indices across globe
Returns (%)
Country
Name of index
Closing price
1M
3M
1YR
Brazil
Bovespa
64,159
(2.5)
0.3
20.5
Russia
Micex
1,920
(5.8)
(11.7)
(1.4)
India
Nifty
9,105
(0.5)
8.3
18.1
China
Shanghai Composite
3,197
(3.0)
0.3
5.4
South Africa
Top 40
45,873
2.8
(0.9)
(1.8)
Mexico
Mexbol
48,763
3.6
5.9
6.8
Indonesia
LQ45
924
2.8
4.7
11.8
Malaysia
KLCI
1,741
(0.3)
4.1
1.5
Thailand
SET 50
998
1.8
1.0
10.7
USA
Dow Jones
20,523
(2.0)
3.2
13.7
UK
FTSE
7,148
(3.0)
(2.5)
11.5
Japan
Nikkei
18,419
(6.0)
(2.1)
16.4
Germany
DAX
12,000
(0.4)
4.3
17.3
France
CAC
4,990
(0.1)
3.0
9.9
Source: Bloomberg, Angel Research, As of April, 19, 2017
Stock Watch
April 20, 2017
Company Name
Reco
CMP
Target
Mkt Cap
Sales ( Čcr )
OPM(%)
EPS (Č)
PER(x)
P/BV(x)
RoE(%)
EV/Sales(x)
(Č)
Price ( Č)
( Č cr )
FY17E
FY18E
FY17E
FY18E
FY17E
FY18E
FY17E
FY18E
FY17E
FY18E
FY17E
FY18E
FY17E
FY18E
Agri / Agri Chemical
Rallis
Neutral
249
-
4,835
1,937
2,164
13.3
14.3
9.0
11.0
27.6
22.6
4.8
4.2
18.4
19.8
2.5
2.2
United Phosphorus
Neutral
773
-
39,183
15,176
17,604
18.5
18.5
37.4
44.6
20.7
17.3
4.1
3.4
21.4
21.2
2.7
2.3
Auto & Auto Ancillary
Amara Raja Batteries
Buy
869
1,009
14,838
5,305
6,100
16.0
16.3
28.4
34.0
30.6
25.6
5.9
4.9
19.3
19.3
2.8
2.4
Apollo Tyres
Neutral
231
-
11,736
12,877
14,504
14.3
13.9
21.4
23.0
10.8
10.0
1.7
1.5
16.4
15.2
1.1
1.0
Ashok Leyland
Buy
81
111
23,123
20,021
21,915
11.6
11.9
4.5
5.3
18.1
15.3
3.7
3.3
20.6
21.5
1.1
1.0
Bajaj Auto
Neutral
2,810
-
81,325
25,093
27,891
19.5
19.2
143.9
162.5
19.5
17.3
5.5
4.7
30.3
29.4
3.0
2.6
Bharat Forge
Neutral
1,047
-
24,381
7,726
8,713
20.5
21.2
35.3
42.7
29.7
24.5
5.5
5.0
18.9
20.1
3.2
2.8
Ceat
Neutral
1,435
-
5,803
7,524
8,624
13.0
12.7
131.1
144.3
10.9
9.9
2.0
1.7
19.8
18.6
0.9
0.7
Eicher Motors
Neutral
25,458
-
69,271
16,583
20,447
17.5
18.0
598.0
745.2
42.6
34.2
14.6
11.1
41.2
38.3
4.0
3.2
Exide Industries
Neutral
234
-
19,852
7,439
8,307
15.0
15.0
8.1
9.3
28.8
25.1
4.0
3.6
14.3
16.7
2.3
2.0
Gabriel India
Accumulate
122
130
1,746
1,544
1,715
9.0
9.3
5.4
6.3
22.5
19.3
4.3
3.8
18.9
19.5
1.1
1.0
Hero Motocorp
Accumulate
3,205
3,446
63,995
28,083
30,096
15.3
15.7
171.8
187.0
18.7
17.1
6.5
5.5
30.1
27.9
2.1
1.9
Indag Rubber
Neutral
203
-
532
286
326
19.8
16.8
11.7
13.3
17.3
15.2
2.9
2.7
17.8
17.1
1.5
1.3
Jamna Auto Industries
Neutral
241
-
1,921
1,486
1,620
9.8
9.9
15.0
17.2
16.1
14.0
3.5
3.0
21.8
21.3
1.4
1.2
JK Tyres
Neutral
142
-
3,225
7,455
8,056
15.0
15.0
21.8
24.5
6.5
5.8
1.4
1.1
22.8
21.3
0.6
0.5
L G Balakrishnan & Bros Neutral
625
-
982
1,302
1,432
11.6
11.9
43.7
53.0
14.3
11.8
2.0
1.8
13.8
14.2
0.8
0.8
Mahindra and Mahindra Neutral
1,260
-
78,255
46,534
53,077
11.6
11.7
67.3
78.1
18.7
16.1
3.0
2.7
15.4
15.8
1.7
1.4
Maruti
Accumulate
6,200
6,560
187,291
67,822
83,288
16.0
16.4
253.8
312.4
24.4
19.9
5.6
4.5
23.0
22.9
2.4
1.9
Minda Industries
Neutral
435
-
3,450
2,728
3,042
9.0
9.1
68.2
86.2
6.4
5.1
1.5
1.2
23.8
24.3
1.3
1.2
Motherson Sumi
Neutral
373
-
52,389
45,896
53,687
7.8
8.3
13.0
16.1
28.6
23.2
9.2
7.4
34.7
35.4
1.2
1.0
Rane Brake Lining
Neutral
1,011
-
800
511
562
11.3
11.5
28.1
30.9
36.0
32.7
5.5
5.0
15.3
15.0
1.7
1.6
Setco Automotive
Neutral
41
-
548
741
837
13.0
13.0
15.2
17.0
2.7
2.4
0.4
0.4
15.8
16.3
1.1
1.0
Subros
Neutral
233
-
1,400
1,488
1,681
11.7
11.9
6.4
7.2
36.5
32.6
3.9
3.5
10.8
11.4
1.2
1.0
Swaraj Engines
Neutral
1,491
-
1,852
660
810
15.2
16.4
54.5
72.8
27.4
20.5
8.5
7.7
31.5
39.2
2.6
2.1
Tata Motors
Neutral
444
-
128,068
300,209
338,549
8.9
8.4
42.7
54.3
10.4
8.2
1.7
1.4
15.6
17.2
0.5
0.5
TVS Motor
Neutral
471
-
22,369
13,390
15,948
6.9
7.1
12.8
16.5
36.9
28.5
9.2
7.3
26.3
27.2
1.7
1.4
Capital Goods
ACE
Neutral
64
-
635
709
814
4.1
4.6
1.4
2.1
45.9
30.6
1.9
1.8
4.4
6.0
1.1
0.9
BEML
Neutral
1,351
-
5,626
3,451
4,055
6.3
9.2
31.4
57.9
43.0
23.3
2.6
2.4
6.3
10.9
1.8
1.5
BGR Energy
Neutral
169
-
1,217
16,567
33,848
6.0
5.6
7.8
5.9
21.6
28.6
1.2
1.2
4.7
4.2
0.2
0.1
Stock Watch
April 20, 2017
Company Name
Reco
CMP
Target
Mkt Cap
Sales ( Čcr )
OPM(%)
EPS (Č)
PER(x)
P/BV(x)
RoE(%)
EV/Sales(x)
(Č)
Price ( Č)
( Č cr )
FY17E
FY18E
FY17E
FY18E
FY17E
FY18E
FY17E
FY18E
FY17E
FY18E
FY17E
FY18E
FY17E
FY18E
Capital Goods
Bharat Electronics
Neutral
179
-
39,915
8,137
9,169
16.8
17.2
58.7
62.5
3.0
2.9
0.5
0.4
44.6
46.3
3.9
3.5
BHEL
Neutral
174
-
42,490
28,797
34,742
-
2.8
2.3
6.9
75.5
25.2
1.3
1.2
1.3
4.8
1.1
0.8
Blue Star
Accumulate
683
760
6,527
4,283
5,077
5.9
7.3
14.9
22.1
45.9
30.9
8.9
7.5
20.4
26.4
1.6
1.3
CG Power and Industrial
Neutral
80
-
4,992
5,777
6,120
5.9
7.0
3.3
4.5
24.1
17.7
1.1
1.0
4.4
5.9
0.8
0.7
Solutions
Greaves Cotton
Neutral
167
-
4,078
1,755
1,881
16.8
16.9
7.8
8.5
21.4
19.7
4.3
4.0
20.6
20.9
2.0
1.8
Inox Wind
Neutral
201
-
4,463
5,605
6,267
15.7
16.4
24.8
30.0
8.1
6.7
2.3
1.7
25.9
24.4
0.8
0.7
KEC International
Neutral
217
-
5,567
9,294
10,186
7.9
8.1
9.9
11.9
21.9
18.2
3.2
2.8
15.6
16.3
0.8
0.8
KEI Industries
Buy
207
239
1,610
2,682
3,058
10.4
10.0
11.7
12.8
17.6
16.2
3.5
2.9
20.1
18.2
0.8
0.7
Thermax
Neutral
995
-
11,856
5,421
5,940
7.3
7.3
25.7
30.2
38.7
33.0
4.7
4.3
12.2
13.1
2.1
1.9
VATech Wabag
Neutral
691
-
3,770
3,136
3,845
8.9
9.1
26.0
35.9
26.6
19.2
3.3
2.8
13.4
15.9
1.1
0.9
Voltas
Neutral
413
-
13,672
6,511
7,514
7.9
8.7
12.9
16.3
32.0
25.4
5.8
5.1
16.7
18.5
1.9
1.6
Cement
ACC
Neutral
1,508
-
28,317
11,225
13,172
13.2
16.9
44.5
75.5
33.9
20.0
3.2
3.0
11.2
14.2
2.5
2.2
Ambuja Cements
Neutral
241
-
47,755
9,350
10,979
18.2
22.5
5.8
9.5
41.5
25.3
3.5
3.1
10.2
12.5
5.1
4.4
India Cements
Neutral
175
-
5,360
4,364
4,997
18.5
19.2
7.9
11.3
22.1
15.4
1.6
1.5
8.0
8.5
2.0
1.7
J K Lakshmi Cement
Neutral
457
-
5,378
2,913
3,412
14.5
19.5
7.5
22.5
60.9
20.3
3.8
3.2
12.5
18.0
2.4
2.0
JK Cement
Neutral
926
-
6,471
4,398
5,173
15.5
17.5
31.2
55.5
29.7
16.7
3.6
3.1
12.0
15.5
2.0
1.7
Orient Cement
Neutral
147
-
3,016
2,114
2,558
18.5
20.5
8.1
11.3
18.2
13.0
2.7
2.3
9.0
14.0
2.0
1.6
UltraTech Cement
Neutral
3,947
-
108,340
25,768
30,385
21.0
23.5
111.0
160.0
35.6
24.7
4.5
4.0
13.5
15.8
4.3
3.6
Construction
Engineers India
Neutral
162
-
10,917
1,725
1,935
16.0
19.1
11.4
13.9
14.2
11.7
2.0
1.9
13.4
15.3
5.3
4.7
Gujarat Pipavav Port
Neutral
164
-
7,916
705
788
52.2
51.7
5.0
5.6
32.8
29.2
3.2
2.9
11.2
11.2
10.9
9.2
ITNL
Neutral
113
-
3,701
8,946
10,017
31.0
31.6
8.1
9.1
13.9
12.4
0.5
0.5
4.2
5.0
3.7
3.5
KNR Constructions
Neutral
206
-
2,895
1,385
1,673
14.7
14.0
41.2
48.5
5.0
4.3
0.9
0.8
14.9
15.2
2.2
1.8
Larsen & Toubro
Neutral
1,671
-
155,940
111,017
124,908
11.0
11.0
61.1
66.7
27.4
25.0
3.3
3.0
13.1
12.9
2.4
2.2
MEP Infra
Neutral
66
-
1,078
1,877
1,943
30.6
29.8
3.0
4.2
22.1
15.8
10.7
7.2
0.6
0.6
2.0
1.8
Nagarjuna Const.
Neutral
96
-
5,351
8,842
9,775
9.1
8.8
5.3
6.4
18.2
15.0
1.4
1.3
8.2
9.1
0.8
0.7
NBCC
Neutral
182
-
16,380
7,428
9,549
7.9
8.6
8.2
11.0
22.2
16.6
1.1
0.9
28.2
28.7
1.9
1.4
PNC Infratech
Neutral
139
-
3,567
2,350
2,904
13.1
13.2
9.0
8.8
15.5
15.8
0.6
0.5
15.9
13.9
1.6
1.3
Power Mech Projects
Neutral
533
-
784
1,801
2,219
12.7
14.6
72.1
113.9
7.4
4.7
1.4
1.2
16.8
11.9
0.4
0.3
Sadbhav Engineering
Neutral
325
-
5,576
3,598
4,140
10.3
10.6
9.0
11.9
36.1
27.3
3.8
3.3
9.9
11.9
1.8
1.6
Stock Watch
April 20, 2017
Company Name
Reco
CMP
Target
Mkt Cap
Sales ( Čcr )
OPM(%)
EPS (Č)
PER(x)
P/BV(x)
RoE(%)
EV/Sales(x)
(Č)
Price ( Č)
( Č cr )
FY17E
FY18E
FY17E
FY18E
FY17E
FY18E
FY17E
FY18E
FY17E
FY18E
FY17E
FY18E
FY17E
FY18E
Construction
Simplex Infra
Neutral
395
-
1,954
6,829
7,954
10.5
10.5
31.4
37.4
12.6
10.6
1.3
1.2
9.9
13.4
0.7
0.6
SIPL
Neutral
102
-
3,605
1,036
1,252
65.5
66.2
(8.4)
(5.6)
3.8
4.4
(22.8)
(15.9)
11.7
9.7
Financials
Axis Bank
Buy
499
580
119,596
46,932
53,575
3.5
3.4
32.4
44.6
15.4
11.2
2.0
1.7
13.6
16.5
-
-
Bank of Baroda
Neutral
175
-
40,311
19,980
23,178
1.8
1.8
11.5
17.3
15.2
10.1
1.7
1.4
8.3
10.1
-
-
Can Fin Homes
Neutral
2,484
-
6,612
420
526
3.5
3.5
86.5
107.8
28.7
23.0
6.2
5.1
23.6
24.1
-
-
Canara Bank
Neutral
317
-
18,922
15,225
16,836
1.8
1.8
14.5
28.0
21.9
11.3
1.5
1.2
5.8
8.5
-
-
Cholamandalam Inv. &
Buy
1,009
1,230
15,775
2,012
2,317
6.3
6.3
42.7
53.6
23.6
18.8
3.7
3.2
16.9
18.3
-
-
Fin. Co.
Dewan Housing Finance Accumulate
401
460
12,567
2,225
2,688
2.9
2.9
29.7
34.6
13.5
11.6
2.2
1.4
16.1
14.8
-
-
Equitas Holdings
Buy
165
235
5,576
939
1,281
11.7
11.5
5.8
8.2
28.5
20.1
2.5
2.2
10.9
11.5
-
-
Federal Bank
Neutral
92
-
15,791
8,259
8,995
3.0
3.0
4.3
5.6
21.3
16.4
1.8
1.7
8.5
10.1
-
-
HDFC
Neutral
1,490
-
236,695
11,475
13,450
3.4
3.4
45.3
52.5
32.9
28.4
6.3
5.6
20.2
20.5
-
-
HDFC Bank
Neutral
1,447
-
370,813
46,097
55,433
4.5
4.5
58.4
68.0
24.8
21.3
4.3
3.6
18.8
18.6
-
-
ICICI Bank
Accumulate
281
315
163,660
42,800
44,686
3.1
3.3
18.0
21.9
15.6
12.8
2.1
2.0
11.1
12.3
-
-
Karur Vysya Bank
Buy
119
140
7,219
5,640
6,030
3.3
3.2
8.9
10.0
13.4
12.0
1.4
1.3
11.2
11.4
-
-
Lakshmi Vilas Bank
Neutral
172
-
3,290
3,339
3,799
2.7
2.8
11.0
14.0
15.6
12.3
1.6
1.5
11.2
12.7
-
-
LIC Housing Finance
Neutral
644
-
32,498
3,712
4,293
2.6
2.5
39.0
46.0
16.5
14.0
3.1
2.7
19.9
20.1
-
-
Punjab Natl.Bank
Neutral
154
-
32,739
23,532
23,595
2.3
2.4
6.8
12.6
22.6
12.2
3.5
2.5
3.3
6.5
-
-
RBL Bank
Neutral
578
-
21,382
1,783
2,309
2.6
2.6
12.7
16.4
45.5
35.3
5.0
4.4
12.8
13.3
-
-
Repco Home Finance
Accumulate
777
825
4,859
388
457
4.5
4.2
30.0
38.0
25.9
20.4
4.3
3.6
18.0
19.2
-
-
South Ind.Bank
Neutral
22
-
4,020
6,435
7,578
2.5
2.5
2.7
3.1
8.3
7.2
1.1
0.9
10.1
11.2
-
-
St Bk of India
Neutral
284
-
230,482
88,650
98,335
2.6
2.6
13.5
18.8
21.1
15.1
2.0
1.8
7.0
8.5
-
-
Union Bank
Neutral
150
-
10,305
13,450
14,925
2.3
2.3
25.5
34.5
5.9
4.3
0.9
0.7
7.5
10.2
-
-
Yes Bank
Neutral
1,605
-
73,284
8,978
11,281
3.3
3.4
74.0
90.0
21.7
17.8
4.1
3.5
17.0
17.2
-
-
FMCG
Akzo Nobel India
Neutral
1,970
-
9,450
2,955
3,309
13.3
13.7
57.2
69.3
34.5
28.4
11.3
9.5
32.7
33.3
3.0
2.6
Asian Paints
Neutral
1,049
-
100,629
17,128
18,978
16.8
16.4
19.1
20.7
54.9
50.7
19.1
18.0
34.8
35.5
5.8
5.2
Britannia
Accumulate
3,428
3,626
41,136
9,594
11,011
14.6
14.9
80.3
94.0
42.7
36.5
17.6
13.6
41.2
-
4.2
3.6
Colgate
Neutral
988
-
26,876
4,605
5,149
23.4
23.4
23.8
26.9
41.5
36.7
23.0
18.0
64.8
66.8
5.8
5.1
Dabur India
Neutral
290
-
51,119
8,315
9,405
19.8
20.7
8.1
9.2
35.8
31.5
10.0
8.3
31.6
31.0
5.8
5.1
GlaxoSmith Con*
Neutral
5,226
-
21,979
4,350
4,823
21.2
21.4
179.2
196.5
29.2
26.6
7.7
6.6
27.1
26.8
4.4
3.9
Stock Watch
April 20, 2017
Company Name
Reco
CMP
Target
Mkt Cap
Sales ( Čcr )
OPM(%)
EPS (Č)
PER(x)
P/BV(x)
RoE(%)
EV/Sales(x)
(Č)
Price ( Č)
( Č cr )
FY17E FY18E
FY17E
FY18E
FY17E
FY18E
FY17E
FY18E
FY17E
FY18E
FY17E
FY18E
FY17E
FY18E
FMCG
Godrej Consumer
Neutral
1,646
-
56,054
10,235
11,428
18.4
18.6
41.1
44.2
40.0
37.2
8.9
7.5
24.9
24.8
5.6
4.9
HUL
Neutral
909
-
196,750
35,252
38,495
17.8
17.8
20.7
22.4
44.0
40.6
42.1
36.1
95.6
88.9
5.4
5.0
ITC
Neutral
279
-
339,033
40,059
44,439
38.3
39.2
9.0
10.1
31.1
27.5
8.7
7.6
27.8
27.5
8.0
7.2
Marico
Neutral
301
-
38,882
6,430
7,349
18.8
19.5
6.4
7.7
47.1
39.1
14.2
12.0
33.2
32.5
5.9
5.1
Nestle*
Neutral
6,301
-
60,750
10,073
11,807
20.7
21.5
124.8
154.2
50.5
40.9
20.7
18.6
34.8
36.7
5.8
5.0
Procter & Gamble
Neutral
7,299
-
23,694
2,939
3,342
23.2
23.0
146.2
163.7
49.9
44.6
12.6
10.5
25.3
23.5
7.6
6.6
Hygiene
Tata Global
Neutral
150
-
9,480
8,675
9,088
9.8
9.8
7.4
8.2
20.3
18.3
1.6
1.5
7.9
8.1
1.0
0.9
IT
HCL Tech^
Buy
808
1,000
115,277
49,242
57,168
20.5
20.5
55.7
64.1
14.5
12.6
3.0
2.3
20.3
17.9
2.2
1.8
Infosys
Buy
919
1,179
211,043
68,484
73,963
26.0
26.0
63.0
64.0
14.6
14.4
3.1
2.8
20.8
19.7
2.8
2.4
TCS
Buy
2,302
2,700
453,543
119,025
133,308
27.6
27.6
131.2
145.5
17.5
15.8
5.7
5.2
32.4
33.1
3.6
3.2
Tech Mahindra
Buy
414
600
40,347
29,673
32,937
15.5
17.0
32.8
39.9
12.6
10.4
2.5
2.1
19.6
20.7
1.1
0.9
Wipro
Buy
498
583
121,133
55,440
60,430
18.1
18.1
36.1
38.9
13.8
12.8
2.5
2.3
19.0
17.6
1.9
1.7
Media
D B Corp
Neutral
380
-
6,980
2,297
2,590
27.4
28.2
21.0
23.4
18.1
16.2
4.2
3.7
23.7
23.1
2.8
2.4
Hindustan Media
Neutral
293
-
2,153
1,016
1,138
24.3
25.2
27.3
30.1
10.7
9.7
2.0
1.8
16.2
15.8
1.4
1.3
Ventures
HT Media
Neutral
83
-
1,935
2,693
2,991
12.6
12.9
7.9
9.0
10.5
9.2
0.9
0.8
7.8
8.3
0.3
0.2
Jagran Prakashan
Accumulate
197
225
6,455
2,355
2,635
28.0
28.0
10.8
12.5
18.3
15.8
4.0
3.4
21.7
21.7
2.8
2.4
Sun TV Network
Neutral
844
-
33,247
2,850
3,265
70.1
71.0
26.2
30.4
32.2
27.8
8.2
7.3
24.3
25.6
11.3
9.7
TV Today Network
Buy
272
344
1,624
567
645
26.7
27.0
15.4
18.1
17.7
15.0
2.7
2.3
14.9
15.2
2.4
2.0
Metals & Mining
Coal India
Neutral
283
-
175,390
84,638
94,297
21.4
22.3
24.5
27.1
11.5
10.4
4.8
4.6
42.6
46.0
1.6
1.4
Hind. Zinc
Neutral
271
-
114,612
14,252
18,465
55.9
48.3
15.8
21.5
17.2
12.6
2.8
2.5
17.0
20.7
8.0
6.2
Hindalco
Neutral
186
-
41,657
107,899
112,095
7.4
8.2
9.2
13.0
20.2
14.3
1.0
0.9
4.8
6.6
0.9
0.8
JSW Steel
Neutral
190
-
45,867
53,201
58,779
16.1
16.2
130.6
153.7
1.5
1.2
0.2
0.2
14.0
14.4
1.6
1.4
NMDC
Neutral
126
-
40,007
6,643
7,284
44.4
47.7
7.1
7.7
17.8
16.4
1.6
1.5
8.8
9.2
3.8
3.4
SAIL
Neutral
61
-
25,049
47,528
53,738
(0.7)
2.1
(1.9)
2.6
23.3
0.7
0.6
(1.6)
3.9
1.4
1.2
Tata Steel
Neutral
451
-
43,846
121,374
121,856
7.2
8.4
18.6
34.3
24.3
13.2
1.5
1.4
6.1
10.1
1.0
1.0
Vedanta
Neutral
234
-
69,418
71,744
81,944
19.2
21.7
13.4
20.1
17.5
11.7
1.5
1.3
8.4
11.3
1.4
1.1
Oil & Gas
Cairn India
Neutral
287
-
53,782
9,127
10,632
4.3
20.6
8.8
11.7
32.6
24.5
1.1
1.0
3.3
4.2
7.4
6.1
GAIL
Neutral
394
-
66,663
56,220
65,198
9.3
10.1
27.1
33.3
14.5
11.8
1.3
1.2
9.3
10.7
1.4
1.2
Indian Oil Corp
Neutral
435
-
211,353
373,359
428,656
5.9
5.5
54.0
59.3
8.1
7.3
1.3
1.1
16.0
15.6
0.7
0.6
Stock Watch
April 20, 2017
Company Name
Reco
CMP
Target
Mkt Cap
Sales ( Čcr )
OPM(%)
EPS (Č)
PER(x)
P/BV(x)
RoE(%)
EV/Sales(x)
(Č)
Price ( Č)
( Č cr )
FY17E FY18E
FY17E
FY18E
FY17E
FY18E
FY17E
FY18E
FY17E
FY18E
FY17E
FY18E
FY17E
FY18E
Oil & Gas
ONGC
Neutral
180
-
230,806
137,222
152,563
15.0
21.8
19.5
24.1
9.2
7.5
0.8
0.7
8.5
10.1
2.0
1.8
Reliance Industries
Neutral
1,370
-
445,384
301,963
358,039
12.1
12.6
87.7
101.7
15.6
13.5
1.6
1.5
10.7
11.3
2.0
1.6
Pharmaceuticals
Alembic Pharma
Accumulate
607
689
11,450
3,483
4,244
20.2
21.4
24.3
33.6
25.0
18.1
5.7
4.5
25.5
25.3
3.2
2.6
Alkem Laboratories Ltd
Accumulate
2,076
2,257
24,818
6,065
7,009
18.7
20.0
80.2
92.0
25.9
22.6
5.8
4.9
22.5
21.6
4.0
3.5
Aurobindo Pharma
Buy
640
877
37,508
15,720
18,078
23.7
23.7
41.4
47.3
15.5
13.5
4.0
3.1
29.6
26.1
2.6
2.3
Aventis*
Neutral
4,507
-
10,380
2,277
2,597
16.6
17.4
128.9
157.0
35.0
28.7
6.0
4.6
21.6
26.4
4.3
3.6
Cadila Healthcare
Neutral
444
-
45,423
10,429
12,318
17.7
21.6
13.1
19.2
33.9
23.1
7.1
5.6
22.8
27.1
4.4
3.6
Cipla
Sell
575
465
46,255
15,378
18,089
15.7
16.8
19.3
24.5
29.8
23.5
3.5
3.1
12.3
13.9
3.2
2.7
Dishman Pharma
Sell
327
143
5,277
1,718
1,890
22.7
22.8
9.5
11.3
34.4
28.9
3.3
3.0
10.1
10.9
3.5
3.1
Dr Reddy's
Neutral
2,611
-
43,263
16,043
18,119
18.0
23.0
78.6
130.9
33.2
20.0
3.2
2.9
10.1
15.2
2.5
2.4
GSK Pharma*
Neutral
2,606
-
22,074
2,800
3,290
10.2
20.6
32.2
60.3
80.9
43.2
15.0
14.8
17.2
34.5
7.7
6.6
Indoco Remedies
Neutral
240
-
2,214
1,112
1,289
16.2
18.2
11.6
16.0
20.7
15.0
3.3
2.8
17.0
20.1
2.1
1.8
Ipca labs
Neutral
606
-
7,651
3,258
3,747
12.8
15.3
12.1
19.2
50.1
31.6
3.1
2.9
6.4
9.5
2.5
2.2
Lupin
Buy
1,412
1,809
63,745
15,912
18,644
26.4
26.7
58.1
69.3
24.3
20.4
4.7
3.9
21.4
20.9
4.1
3.4
Sun Pharma
Buy
664
847
159,393
31,129
35,258
32.0
32.9
30.2
35.3
22.0
18.8
3.6
3.0
20.0
20.1
4.7
4.0
Power
NTPC
Neutral
165
-
135,803
86,605
95,545
17.5
20.8
11.8
13.4
14.0
12.3
1.4
1.3
10.5
11.1
2.9
2.9
Power Grid
Accumulate
211
223
110,465
25,315
29,193
88.2
88.7
14.2
17.2
14.9
12.3
2.3
2.0
15.2
16.1
9.0
8.1
Tata Power
Neutral
86
-
23,166
36,916
39,557
17.4
27.1
5.1
6.3
16.8
13.6
1.5
1.4
9.0
10.3
1.6
1.5
Real Estate
MLIFE
Buy
409
522
1,678
1,152
1,300
22.7
24.6
29.9
35.8
13.7
11.4
1.0
1.0
7.6
8.6
2.2
1.8
Prestige Estate
Neutral
244
-
9,154
4,707
5,105
25.2
26.0
10.3
13.0
23.7
18.8
1.9
1.8
10.3
10.2
3.1
2.8
Telecom
Bharti Airtel
Neutral
340
-
135,912
105,086
114,808
34.5
34.7
12.2
16.4
27.9
20.7
1.9
1.8
6.8
8.4
2.2
1.9
Idea Cellular
Neutral
86
-
30,988
40,133
43,731
37.2
37.1
6.4
6.5
13.4
13.2
1.1
1.0
8.2
7.6
1.8
1.5
zOthers
Abbott India
Neutral
4,614
-
9,805
3,153
3,583
14.1
14.4
152.2
182.7
30.3
25.3
148.9
127.1
25.6
26.1
2.8
2.4
Asian Granito
Accumulate
374
405
1,125
1,060
1,169
12.2
12.5
12.7
15.9
29.5
23.5
2.8
2.5
9.5
10.7
1.4
1.2
Bajaj Electricals
Accumulate
352
395
3,569
4,801
5,351
5.7
6.2
10.4
13.7
33.8
25.8
4.2
3.7
12.4
14.5
0.7
0.7
Banco Products (India)
Neutral
225
-
1,612
1,353
1,471
12.3
12.4
14.5
16.3
15.6
13.8
21.5
19.3
14.5
14.6
1.1
121.7
Coffee Day Enterprises
Neutral
251
-
5,174
2,964
3,260
20.5
21.2
4.7
8.0
-
31.4
2.9
2.7
5.5
8.5
2.2
1.9
Ltd
Competent Automobiles Neutral
223
-
137
1,137
1,256
3.1
2.7
28.0
23.6
8.0
9.4
42.9
38.7
14.3
11.5
0.1
0.1
Elecon Engineering
Neutral
61
-
680
1,482
1,660
13.7
14.5
3.9
5.8
15.6
10.5
3.7
3.4
7.8
10.9
0.8
0.7
Stock Watch
April 20, 2017
Company Name
Reco
CMP
Target
Mkt Cap
Sales ( Čcr )
OPM(%)
EPS (Č)
PER(x)
P/BV(x)
RoE(%)
EV/Sales(x)
(Č)
Price ( Č)
( Č cr )
FY17E
FY18E
FY17E
FY18E
FY17E
FY18E
FY17E
FY18E
FY17E
FY18E
FY17E
FY18E
FY17E
FY18E
zOthers
Finolex Cables
Neutral
539
-
8,240
2,883
3,115
12.0
12.1
14.2
18.6
37.9
29.0
20.2
17.6
15.8
14.6
2.6
2.3
Garware Wall Ropes
Neutral
758
-
1,659
863
928
15.1
15.2
36.4
39.4
20.8
19.3
3.8
3.2
17.5
15.9
1.8
1.7
Goodyear India*
Neutral
877
-
2,022
1,598
1,704
10.4
10.2
49.4
52.6
17.8
16.7
81.9
71.9
18.2
17.0
1.0
135.5
Hitachi
Neutral
1,812
-
4,928
2,081
2,433
8.8
8.9
33.4
39.9
54.3
45.4
43.8
36.5
22.1
21.4
2.4
2.0
HSIL
Neutral
351
-
2,534
2,384
2,515
15.8
16.3
15.3
19.4
22.9
18.1
22.8
19.6
7.8
9.3
1.2
1.1
Interglobe Aviation
Neutral
1,086
-
39,259
21,122
26,005
14.5
27.6
110.7
132.1
9.8
8.2
58.7
41.9
168.5
201.1
1.8
1.4
Jyothy Laboratories
Neutral
388
-
7,056
1,440
2,052
11.5
13.0
8.5
10.0
45.7
38.8
11.1
10.2
18.6
19.3
5.2
3.6
Kirloskar Engines India
Neutral
396
-
5,727
2,554
2,800
9.9
10.0
10.5
12.1
37.7
32.7
15.8
14.9
10.7
11.7
1.9
1.7
Ltd
Linc Pen & Plastics
Neutral
290
-
429
382
420
9.3
9.5
13.5
15.7
21.6
18.5
3.7
3.2
17.1
17.3
1.2
1.1
M M Forgings
Neutral
592
-
714
546
608
20.4
20.7
41.3
48.7
14.3
12.2
81.1
71.8
16.6
17.0
1.2
1.0
Manpasand Bever.
Neutral
726
-
4,152
836
1,087
19.6
19.4
16.9
23.8
43.0
30.5
5.2
4.5
12.0
14.8
4.7
3.5
Mirza International
Buy
89
107
1,067
963
1,069
17.2
18.0
6.1
7.5
14.5
11.8
2.2
1.9
15.0
15.7
1.3
1.2
MT Educare
Neutral
80
-
318
366
417
17.7
18.2
9.4
10.8
8.5
7.4
1.9
1.6
22.2
22.3
0.8
0.7
Narayana Hrudaya
Neutral
320
-
6,536
1,873
2,166
11.5
11.7
2.6
4.0
120.9
80.7
7.4
6.7
6.1
8.3
3.6
3.1
Navkar Corporation
Buy
207
265
2,956
369
561
42.9
42.3
6.9
11.5
30.0
18.0
2.1
1.9
7.4
10.5
9.0
5.9
Navneet Education
Neutral
167
-
3,904
1,062
1,147
24.0
24.0
6.1
6.6
27.4
25.2
5.6
5.0
20.6
19.8
3.8
3.5
Nilkamal
Neutral
1,921
-
2,867
1,995
2,165
10.7
10.4
69.8
80.6
27.5
23.8
109.8
95.4
16.6
16.5
1.4
1.3
Page Industries
Neutral
14,059
-
15,681
2,450
3,124
20.1
17.6
299.0
310.0
47.0
45.4
313.1
239.0
47.1
87.5
6.5
5.1
Parag Milk Foods
Neutral
251
-
2,107
1,919
2,231
9.3
9.6
9.5
12.9
26.5
19.4
4.1
3.4
15.5
17.5
1.3
1.1
Quick Heal
Neutral
244
-
1,708
408
495
27.3
27.0
7.7
8.8
31.5
27.7
2.9
2.9
9.3
10.6
3.3
2.8
Radico Khaitan
Buy
108
147
1,435
1,667
1,824
13.0
13.2
6.7
8.2
16.2
13.2
1.5
1.3
9.0
10.2
1.3
1.1
Relaxo Footwears
Neutral
495
-
5,952
2,085
2,469
9.2
8.2
7.6
8.0
65.5
62.3
25.4
21.7
17.9
18.8
2.9
2.5
S H Kelkar & Co.
Neutral
324
-
4,692
1,036
1,160
15.1
15.0
6.1
7.2
53.1
45.2
5.7
5.2
10.7
11.5
4.4
3.9
Siyaram Silk Mills
Accumulate
1,714
1,872
1,606
1,652
1,857
11.6
11.7
92.4
110.1
18.5
15.6
2.7
2.4
14.7
15.2
1.2
1.1
Styrolution ABS India*
Neutral
753
-
1,324
1,440
1,537
9.2
9.0
40.6
42.6
18.6
17.7
47.4
43.1
12.3
11.6
0.9
0.8
Surya Roshni
Neutral
217
-
953
3,342
3,625
7.8
7.5
17.3
19.8
12.6
11.0
23.9
19.2
10.5
10.8
0.5
0.5
Team Lease Serv.
Neutral
1,045
-
1,787
3,229
4,001
1.5
1.8
22.8
32.8
45.9
31.8
4.9
4.3
10.7
13.4
0.5
0.4
The Byke Hospitality
Neutral
204
-
818
287
384
20.5
20.5
7.6
10.7
26.9
19.1
5.6
4.5
20.7
23.5
2.9
2.1
Transport Corporation of
Neutral
234
-
1,792
2,671
2,911
8.5
8.8
13.9
15.7
16.9
15.0
2.3
2.1
13.7
13.8
0.8
0.7
India
Stock Watch
April 20, 2017
Company Name
Reco
CMP
Target Mkt Cap
Sales ( Čcr )
OPM(%)
EPS (Č)
PER(x)
P/BV(x)
RoE(%)
EV/Sales(x)
(Č)
Price ( Č)
( Č cr )
FY17E FY18E FY17E FY18E FY17E FY18E FY17E FY18E FY17E FY18E FY17E FY18E FY17E FY18E
zOthers
TVS Srichakra
Neutral
3,623
-
2,774
2,304
2,614
13.7
13.8
231.1
266.6
15.7
13.6
407.1
320.5
33.9
29.3
1.2
1.0
UFO Moviez
Neutral
444
-
1,226
619
685
33.2
33.4
30.0
34.9
14.8
12.7
2.1
1.8
13.8
13.9
1.7
1.3
Visaka Industries
Neutral
317
-
503
1,051
1,138
10.3
10.4
21.0
23.1
15.1
13.7
40.6
38.1
9.0
9.2
0.7
0.7
VRL Logistics
Neutral
341
-
3,110
1,902
2,119
16.7
16.6
14.6
16.8
23.4
20.3
5.1
4.5
21.9
22.2
1.8
1.5
Wonderla Holidays
Neutral
385
-
2,174
287
355
38.0
40.0
11.3
14.2
34.1
27.1
4.9
4.3
21.4
23.9
7.3
5.9
VIP Industries
Accumulate
193
218
2,727
1,270
1,450
10.4
10.4
5.6
6.5
34.5
29.7
7.2
6.2
20.7
21.1
2.1
1.9
Navin Fluorine
Buy
3,146
3,650
3,080
789
945
21.1
22.4
120.1
143.4
26.2
21.9
4.2
3.6
17.8
18.5
3.8
3.1
Source: Company, Angel Research; Note: *December year end; #September year end; &October year end; Price as on April 19, 2017
Market Outlook
April 20, 2017
Research Team Tel: 022 - 39357800
DISCLAIMER
Angel Broking Private Limited (hereinafter referred to as “Angel”) is a registered Member of National Stock Exchange of India
Limited,Bombay Stock Exchange Limited and Metropolitan Stock Exchange Limited. It is also registered as a Depository Participant with
CDSL and Portfolio Manager with SEBI. It also has registration with AMFI as a Mutual Fund Distributor. Angel Broking Private Limited is a
registered entity with SEBI for Research Analyst in terms of SEBI (Research Analyst) Regulations, 2014 vide registration number
INH000000164. Angel or its associates has not been debarred/ suspended by SEBI or any other regulatory authority for accessing
/dealing in securities Market. Angel or its associates/analyst has not received any compensation / managed or
co-managed public offering of securities of the company covered by Analyst during the past twelve months.
This document is solely for the personal information of the recipient, and must not be singularly used as the basis of any investment
decision. Nothing in this document should be construed as investment or financial advice. Each recipient of this document should make
such investigations as they deem necessary to arrive at an independent evaluation of an investment in the securities of the companies
referred to in this document (including the merits and risks involved), and should consult their own advisors to determine the merits and
risks of such an investment.
Reports based on technical and derivative analysis center on studying charts of a stock's price movement, outstanding positions and
trading volume, as opposed to focusing on a company's fundamentals and, as such, may not match with a report on a company's
fundamentals. Investors are advised to refer the Fundamental and Technical Research Reports available on our website to evaluate the
contrary view, if any.
The information in this document has been printed on the basis of publicly available information, internal data and other reliable
sources believed to be true, but we do not represent that it is accurate or complete and it should not be relied on as such, as this
document is for general guidance only. Angel Broking Pvt. Limited or any of its affiliates/ group companies shall not be in any way
responsible for any loss or damage that may arise to any person from any inadvertent error in the information contained in this report.
Angel Broking Pvt. Limited has not independently verified all the information contained within this document. Accordingly, we cannot
testify, nor make any representation or warranty, express or implied, to the accuracy, contents or data contained within this document.
While Angel Broking Pvt. Limited endeavors to update on a reasonable basis the information discussed in this material, there may be
regulatory, compliance, or other reasons that prevent us from doing so.
This document is being supplied to you solely for your information, and its contents, information or data may not be reproduced,
redistributed or passed on, directly or indirectly.
Neither Angel Broking Pvt. Limited, nor its directors, employees or affiliates shall be liable for any loss or damage that may arise from
or in connection with the use of this information.